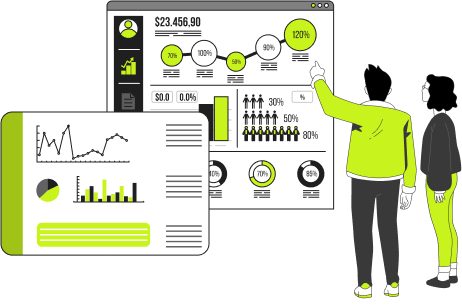
As an analytics expert, I use the latest BI tools to provide impactful data visualization and reporting solutions. Here’s what I help you achieve:
Clearly communicate complex or big data
Identify patterns and trends
Pinpoint the actions that drive results
Make informed, data-backed decisions
Automate manual reporting processes
Enable easy data exploration and self-service
Improve data quality and accuracy
Accelerate smarter decision-making
Clients Testimonials
I’ve 1253+ Clients Feedback
Brian Roehm
Dana Willhoit
Hey Silly Milly
Lee Stemm
Lee Stemm
Lori Kleiman
Monique Brennan
Mark Smith
Mark Smith
What I Offer
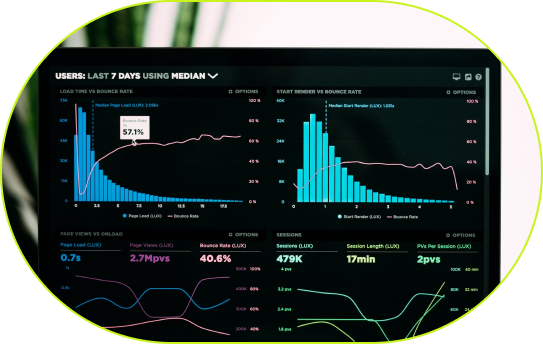
In today’s data-heavy world, making sense of it all is key. My Data Visualization & Reporting Services help you interpret massive amounts of data in ways that are both meaningful and strategic.
I use tools like Tableau, Power BI, Looker Studio, and Swydo to create clear, interactive dashboards and reports. With expertise in ETL processes and data management, I integrate and analyze data from multiple sources to provide actionable insights.
Talk data strategy with an expert
Sign up to meet with one of our analytics experts who will review your data struggles and help map out steps to achieve data-driven decision making.
In today’s data-driven world, understanding and interpreting vast amounts of information is crucial for making informed decisions. Our Data Visualization & Reporting Services are designed to help businesses transform complex data into meaningful insights.


")