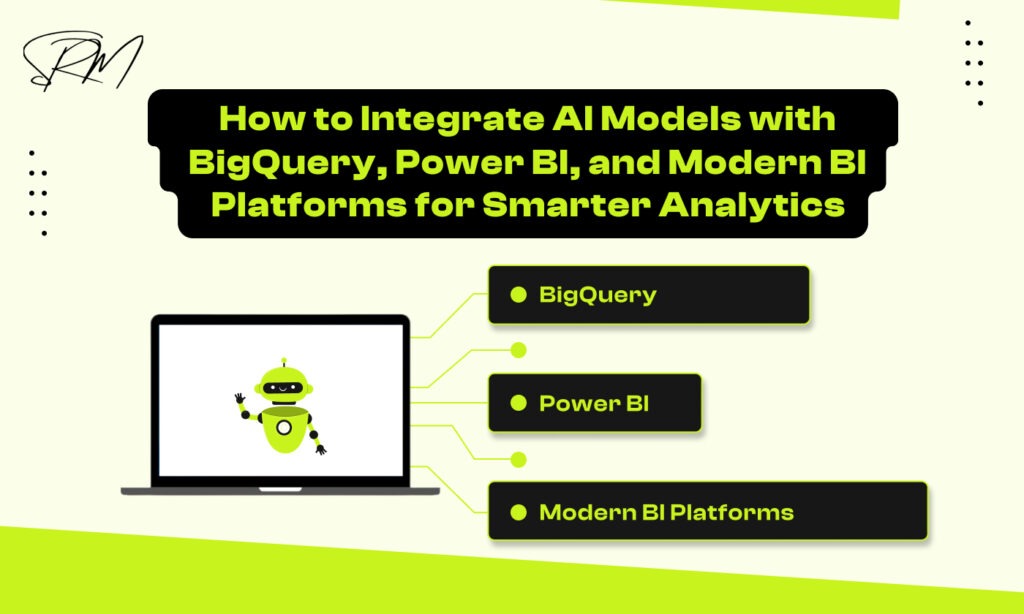
How to Integrate AI..
Data analytics has changed. It is no longer enough to just look in the rearview...
Read MoreEmpowering businesses with impactful digital strategies.
Make sense of complex, scattered data with analytics that reveal opportunities, highlight performance gaps, and support confident decision-making.
Modern dashboards, automated reporting, and deep analytics help brands move from guesswork to clarity enabling faster, smarter, and more profitable decisions.
From ads to analytics, we implement precision tracking across every major platform turning disconnected data into powerful, growth-driven insights.
Track every impression, click, and conversion to reveal what truly drives ROI.
Centralize all your tags, triggers, and pixels with error-free GTM setup.
Unlock complete customer journey insights with event-based tracking done right.
Capture every lead and sale accurately with browser & server-side tracking.
Measure B2B engagement and conversions directly from your LinkedIn campaigns.
Track every product view, add-to-cart, and purchase with precision.
Connect your forms, pages, and CTAs to analytics for full-funnel visibility.
Extend your conversion tracking and remarketing beyond Google and Meta.
We design custom dashboards using Power BI, Tableau, and Looker Studio, integrating data from Airbyte and Supermetrics. This includes data modeling, metric creation, analytical visuals, and layouts for leadership, marketing, finance, sales, and operations.
The result is a scalable analytics system that your entire team can use with ease.
Our team builds automated data pipelines and warehouse systems using Snowflake, BigQuery, Redshift, Databricks, dbt, Airflow, Python, Fivetran, Meltano, Airbyte, and Supermetrics to keep your data accurate and up to date.
We also automate dashboards, scheduled reports, alerts, and AI-generated summaries to eliminate manual reporting.
We analyze data from ads, website traffic, CRM platforms, and attribution models to understand how each channel influences performance and revenue. This improves ROI tracking, campaign optimization, and audience insights.
You get a complete view of marketing effectiveness to support smarter, data-driven decisions.
Predictive models are created to forecast revenue, churn, demand, and retention using historical trends and market signals. This helps you plan budgets, optimize resources, and project future performance more accurately.
We enable confident decision-making for sustainable growth and scaling.
Data analytics is the process of examining raw data to uncover meaningful insights, patterns, and trends that support smarter decision-making. Instead of relying on assumptions or fragmented reports, analytics turns your business data into clear, reliable intelligence.
It helps you:
Effective data analytics bridges the gap between information and action giving businesses the clarity they need to optimize operations, improve performance, and grow with confidence.
When your data is connected, clean, and easy to understand, it doesn’t just look good. It changes how the business runs day to day. With a solid analytics foundation, you can:
Good analytics is not a “nice to have” — it becomes part of how your team thinks, plans, and makes decisions.
Trust is built on security. We embed robust Data Governance and security practices into every pipeline we engineer.
Helps you understand what has happened in your business. Includes: performance summaries, KPI tracking, historical trend analysis, and aggregated reporting.
Explains why something happened by analyzing relationships, correlations, and root causes. Includes: anomaly detection, segmentation analysis, funnel breakdowns, and problem-source identification.
Uses statistical models and machine learning to forecast what is likely to happen next. Includes: demand forecasting, churn prediction, revenue projections, and trend forecasting.
Provides data-backed recommendations on what to do next. Includes: optimization models, decision simulations, A/B test insights, and scenario analysis.
Reveals how users behave across products, websites, apps, or funnels. Includes: customer journeys, cohort analysis, retention insights, and user-path analysis.
Improves internal efficiency, team performance, and daily operations. Includes: SLAs, process bottlenecks, resource utilization, and operational KPIs.
As a Data Analytics Expert with 10+ years of experience, I turn complex data into clear insights that support smarter decisions. I help businesses fix tracking issues, build accurate dashboards, and understand what their numbers truly mean. The goal is always to simplify data, make it actionable, and align it with real business outcomes whether it’s improving marketing performance, increasing revenue, or identifying new growth opportunities.
I work closely with leadership to align the analytics strategy with core business goals and priorities.
From data architecture to delivering complete analytics systems, I take full lifecycle ownership with accuracy and consistency.
Your team is trained to interpret insights, understand dashboards, and apply analytics effectively in daily decisions.
Continuous enhancements keep your analytics ecosystem accurate, efficient, and aligned with evolving business needs.
When your data is connected, clean, and easy to understand, it doesn’t just look good. It changes how the business runs day to day. With a solid analytics foundation, you can
Access clean, business-ready data in near real-time, moving your team from reactive reporting to proactive strategy.
Eliminate manual data extraction and loading (ETL/ELT). Your data moves reliably, 24/7.
Empower your Finance, Marketing, and Operations teams with self-service, automated dashboards.
Right-sizing cloud resources and optimizing ETL/ELT workflows to dramatically reduce data storage and processing costs.
Future-proof your data stack to effortlessly handle 10x growth in data volume without performance degradation.
Implementing rigorous monitoring and orchestration ensures a data infrastructure with enterprise-grade uptime.
Our Proven Data Pipeline Development Process
Understanding your goals, challenges, data sources, and KPIs.
Designing scalable data architecture and system blueprints.
Building automated ETL/ELT pipelines for clean, reliable data.
Creating intuitive and interactive dashboards tailored to your workflows.
Launching your analytics system with security and compliance.
Continuous optimization, maintenance, and performance monitoring.
Our Proven Data Pipeline Development Process
The first step is to assess your existing systems, data sources, and any challenges you're facing. Key deliverables include source mapping, schema reviews, and a comprehensive data flow assessment to identify gaps and pain points.
Next, we design the core structure of your data ecosystem. This phase involves planning the ETL or ELT processes, cloud architecture, and the design of your data warehouse or lakehouse, along with defining integration requirements.
Selecting the right tools is essential for optimal performance and scalability. Based on your specific needs, we choose the most suitable technologies for data integration, orchestration, storage, and analytics to ensure efficiency across the entire pipeline.
In this stage, we develop robust data pipelines that automatically extract, clean, transform, and load data into your warehouse. These pipelines are designed to be reliable and high-performing, ensuring seamless data flow.
Data accuracy, schema consistency, and overall reliability are thoroughly tested before deployment. This ensures that the pipeline performs as expected and meets all your quality standards.
Automation of workflows is set up, including alerts, scheduling, and monitoring dashboards. This ensures that your data pipeline operates smoothly and efficiently with minimal manual intervention.
We deploy your pipelines without disrupting current operations, ensuring a seamless integration into your existing systems. Post-deployment, we focus on continuous optimization for performance improvements.
After deployment, we offer continuous support, monitoring, and debugging services. Our goal is to ensure long-term pipeline efficiency through ongoing optimization and management.
Shiwali transformed our scattered data into a unified dashboard that saved 15 hours per week. Fast, accurate, and strategic.
Her ROI forecasting model alone delivered 10x value. Highly recommended for financial analytics.
She understood marketing deeply. Our attribution dashboard changed how we scale campaigns.
Data analytics has changed. It is no longer enough to just look in the rearview...
Read More
In the modern world of work, businesses are swimming in a vast ocean of information....
Read More
Not long ago, business decisions were based on monthly reports, static dashboards, and a fair...
Read MoreFuture-proof your data infrastructure with embedded intelligence that goes beyond simple automation.
I convert complex datasets into visuals that answer real business questions.
Every dashboard is customized to your business needs — no templates.
Systems that grow with your data and your company.
High-quality dashboards delivered quickly and accurately.
Governance, role-based access, encryption, and audit-ready architecture.
Timelines depend on data volume, integrations, and the complexity of insights required. Simple analytics dashboards or reports take 1–2 weeks, while full analytics pipelines, modeling, or multi-source integrations typically take 4–6 weeks.
The right tool depends on your needs. Power BI is great for Microsoft users, Tableau offers advanced visualizations, and Looker Studio is ideal for Google-based environments. We help you choose the best one based on your business goals.
We use Airbyte, Supermetrics, and APIs to pull data from multiple platforms into a unified warehouse, ensuring accurate, automated, and reliable analytics.
Our analytics systems are custom-built around your business goals, fully automated, and designed for accuracy. We deliver clear, actionable insights with scalable data pipelines that support fast, confident decision-making.
Yes! We automate real-time reporting, scheduled dashboards, and AI-powered summaries, eliminating manual work and keeping your team informed with the latest data insights.
We use predictive analytics models to forecast revenue, churn, and retention trends. This helps businesses plan budgets, optimize resources, and make informed decisions to drive sustainable growth.
See real-world data pipelines built for automation, reliability, and scale.
Whether you are a startup or an enterprise, the first step to clean, reliable data is a clear diagnosis.
Do not delay your data future. Get the clarity you need to move forward.
Find out in 60 seconds. Get a 100% free instant report on your site's biggest tracking mistakes.