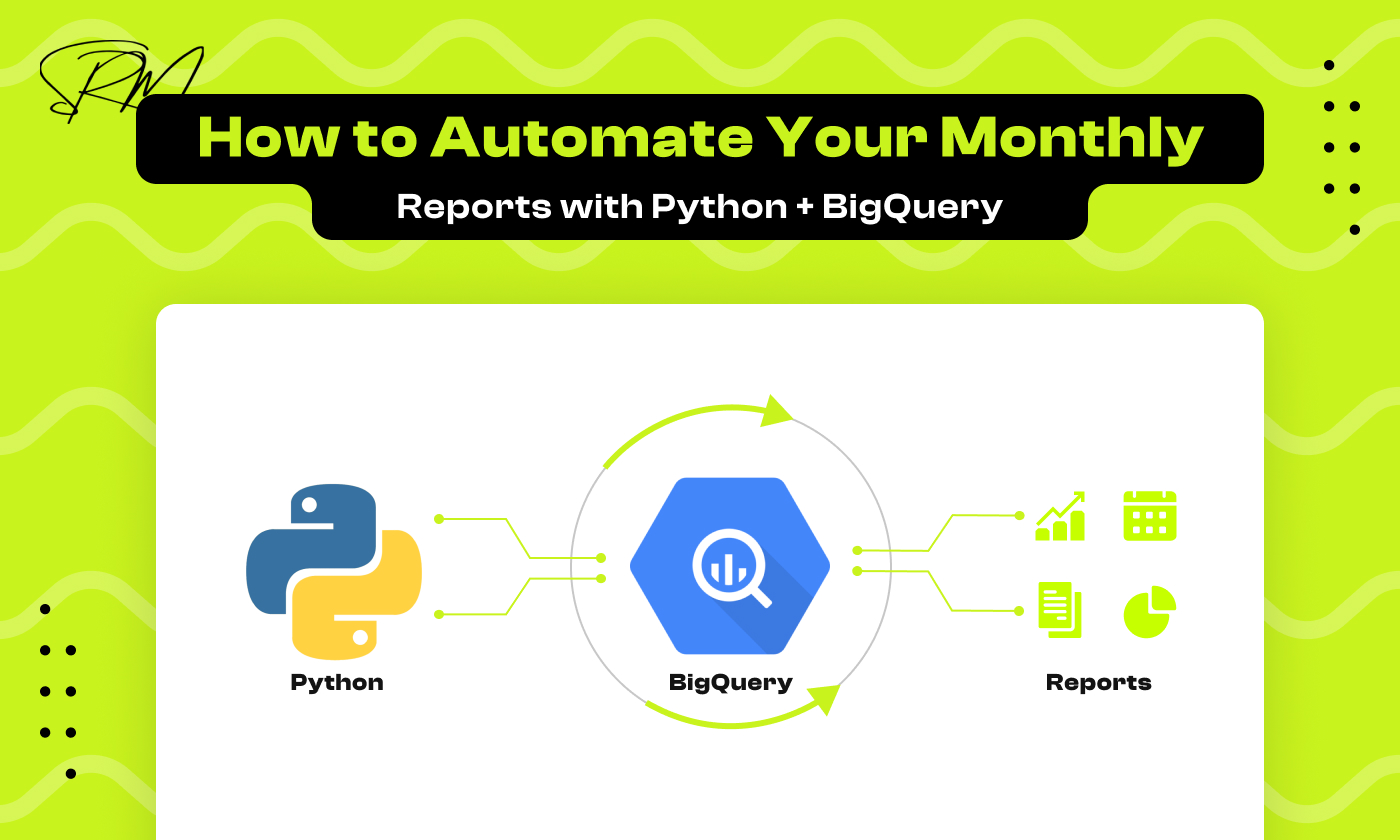
How to Automate Your Monthly Reports with Python + BigQuery
Table of Contents
Monthly reports can be fully automated using Python, Google BigQuery, and serverless cloud tools, eliminating manual spreadsheets while improving accuracy and consistency.
If youʼre anything like me, the phrase “monthly reportingˮ probably conjures images of tedious spreadsheet edits, last-minute data scrambles, and the never-ending refresh cycle of your dashboards. Itʼs the recurring chore that drains hours from your week time that could be better spent on strategy, optimization, and growth.
But what if I told you thereʼs a definitive way to make your life dramatically easier by automating the entire reporting process? Imagine reclaiming those hours and redirecting your focus entirely toward insights, not busywork.
This week, weʼre diving into exactly that: how to build a robust, serverless data pipeline to automate your monthly reports. We’ll combine:
- The agility of Python for extracting data from APIs,
- The lightning speed of Google BigQuery for data transformation, and
- The reliability of cloud orchestration tools like Google Cloud Functions for scheduling and automation.
Along the way, Iʼll share practical code snippets, demonstrate how to conquer real-world challenges (like extracting crucial marketing data from Klaviyoʼs API), and highlight the measurable efficiency and accuracy gains automation brings to your team.
Itʼs time to stop manually assembling data and start leveraging it to drive real business results.
So grab a coffee, leave the stress behind, and letʼs make your reporting smarter, more reliable, and unequivocally easier. Letʼs build the future of your data workflow today.
Why Automate Your Reports?
Automating monthly reports reduces manual effort, improves data accuracy, and ensures consistent, scalable reporting across teams.
Before getting into the “how,” letʼs quickly underline the “why.” Automation isnʼt just about saving time (although thatʼs a big part). It also changes how trustworthy and repeatable your reporting process becomes.
With automation, monthly reports stop being manual deliverables and become reliable, system-generated business intelligence outputs.
Eliminate Human Error: Guaranteeing Data Integrity
Manual data copy-pasting is the single greatest source of mistakes in any reporting process. A single forgotten filter, a mismatched VLOOKUP, or a missed cell selection can skew insights, lead to flawed decisions, and erode trust in your numbers.
- Before Automation: Mistakes are a function of fatigue, volume, and complexity. The larger the spreadsheet, the higher the risk of a critical error.
- After Automation: Your code runs the exact same logic on every execution. The ETL (Extract, Transform, Load) process typically built using Python and BigQuery SQL is validated once and reused indefinitely. This turns the automated pipeline into a single source of truth, virtually eliminating human transcription mistakes.
Boost Consistency: Achieving Strategic Reliability
Strategic reliability depends on consistent reporting. When different team members pull data at different times using slightly different methods, the resulting reports are incomparable.
- Standardized Metrics: Automation enforces a single, universal definition for every KPI (for example, Open Rate or Revenue Per Recipient), calculated centrally using SQL in Google BigQuery.
- Predictable Timing: Reports are generated and available at the exact same minute every month using scheduled workflows (such as Google Cloud Functions). This predictability shifts teams from reactive data collection to planned analysis.
Free Up Mental Bandwidth: Focus on Analysis, Not Assembly
Your team’s highest value is in synthesizing information, drawing conclusions, and recommending actions. Data wrangling is a costly distraction that exhaustscognitive resources.
- Reallocate Analyst Time: Automation liberates analysts from tedious, repetitive tasks (like spending 6 hours pulling Klaviyo metrics). This time is immediately redirected toward deeper A/B testing analysis, building advanced forecasting models, or defining next quarter’s strategy.
- Enhanced Job Satisfaction: By replacing “busywork” with intellectual challenges, automation increases job satisfaction and retention among high-value data professionals.
Scale Effortlessly: Future-Proofing Your Reporting
As your marketing efforts expand (adding new channels, campaigns, or products), your reporting needs should not collapse under the weight of manual effort.
- Horizontal Scalability: Adding a new data source (e.g., Facebook Ads) or integrating a new Klaviyo flow only requires adding a small, modular Python function and an update to the BigQuery SQL not adding hours to the monthly workload.
- Custom KPI Integration: Need a complex, custom KPI (like profit margin per campaign)? You define the logic once in BigQuery, and the pipeline immediately incorporates it into every future report without extra manual labor. The automation infrastructure is built to handle growth without friction
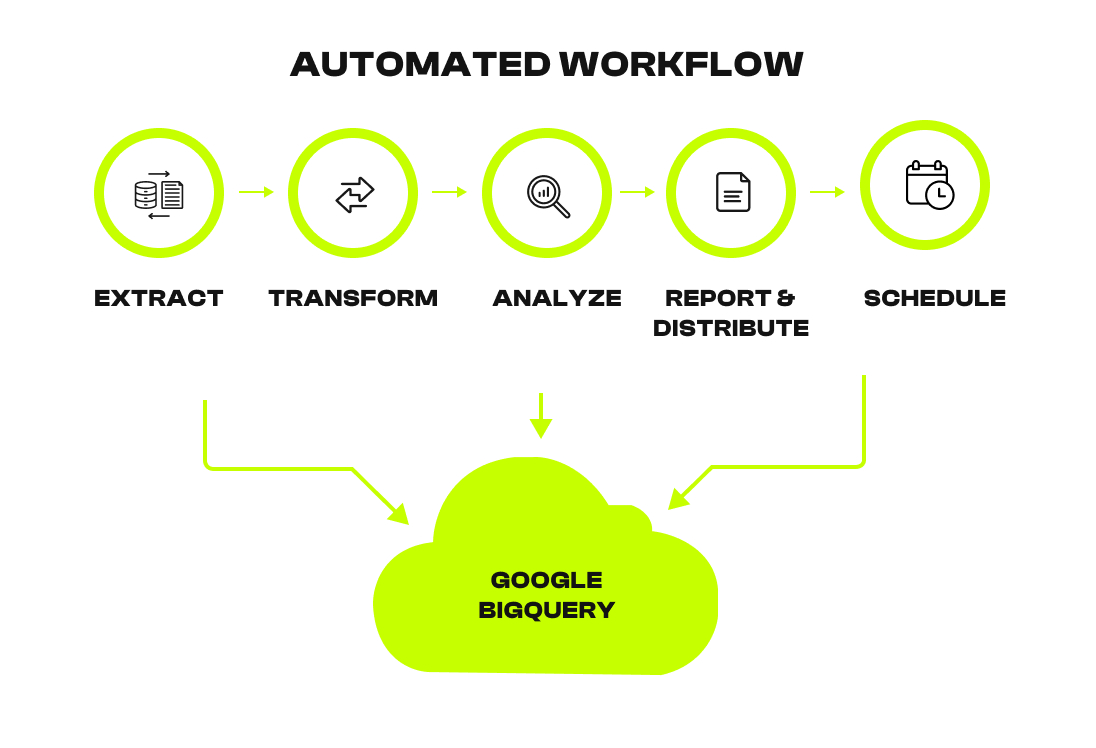
The Automated Workflow: From API to Insight
An automated reporting workflow follows a structured Extract → Load → Transform → Analyze → Schedule pipeline.
Each step has a clear responsibility, which makes the system reliable, debuggable, and easy to scale.
Hereʼs the high-level flow we will implement:
Extract (Python): Fetching Data from APIs
The first step is data extraction. Python is used to authenticate with external platforms and fetch raw data in a controlled, repeatable way.
- Authenticate securely with the Klaviyo API
- Fetch monthly campaign and flow performance data
- Handle pagination, rate limits, and API retries
- Store responses in structured JSON format
Using Python for extraction ensures the same data logic runs every month without manual exports.
Load (Python + BigQuery): Storing Raw Data Safely
Once data is extracted, it needs a reliable place to live.
- Raw JSON data is pushed directly into a staging table in Google BigQuery
- No transformations are applied at this stage
- Data is stored exactly as received from the API
This staging layer is important because it:
- Preserves raw source data
- Allows reprocessing if logic changes
- Makes debugging and validation easier
Transform (BigQuery SQL): Creating Business-Ready Metrics
Raw data is not suitable for reporting. Transformation turns raw events into meaningful metrics.
- Use BigQuery SQL to clean, normalize, and aggregate data
- Calculate KPIs such as:
- Open Rate
- Click Rate
- Revenue per Recipient
- Open Rate
- Create a final, analytics-ready reporting table
Keeping transformations in BigQuery ensures:
- Fast performance on large datasets
- Transparent, version-controlled logic
- Consistent KPI definitions across teams
Analyze & Report (Looker Studio): Turning Data into Insights
Once the final table is ready, it becomes the foundation for reporting.
- Connect Looker Studio directly to BigQuery
- Build charts, tables, and time-based comparisons
- Share dashboards via email or links
- Ensure stakeholders always see up-to-date data
Because Looker Studio reads from BigQuery, reports update automatically when the pipeline runs.
Schedule (Cron / Cloud): Automating the Entire Pipeline
The final step removes human involvement completely.
- Use Google Cloud Functions to run Python code
- Trigger execution on a monthly schedule using a cron-based scheduler
- Ensure reports refresh at the same time every month
Once scheduled, the pipeline:
- Runs without manual intervention
- Produces consistent results
- Eliminates last-minute reporting stress
Our Example Project: Klaviyo API + BigQuery
You can automate monthly marketing reports by extracting email performance data from the Klaviyo API using Python, storing it in Google BigQuery, and scheduling the workflow with Google Cloud Functions so reports update automatically.
To make this concrete, letʼs use a marketing data example: extracting email campaign stats from Klaviyo via their API, storing the data in BigQuery, and automating the entire workflow with Python and Google Cloud Functions.
Klaviyo offers a rich API to pull data like open rates, click rates, unsubscribes, and revenue metrics. Capturing this data monthly allows marketers to track campaign effectiveness automatically without manual exports or spreadsheets.
Step 1: Pulling Klaviyo Data with Python
The first step is to pull raw campaign data from the Klaviyo API using Python. Hereʼs a short snippet illustrating how to request metrics from the API: import requests
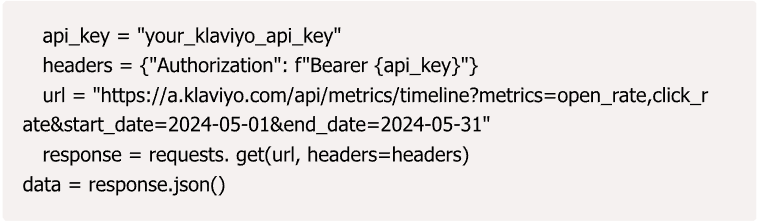
Once retrieved, this JSON data can be cleaned up and transformed for loading into BigQuery.
Step 2: Loading Data into BigQuery
BigQuery becomes our centralized data warehouse, ensuring fast queries and seamless integration with other datasets.
Using the google-cloud-bigquery Python client, you can upload data as follows (pseudo-code):
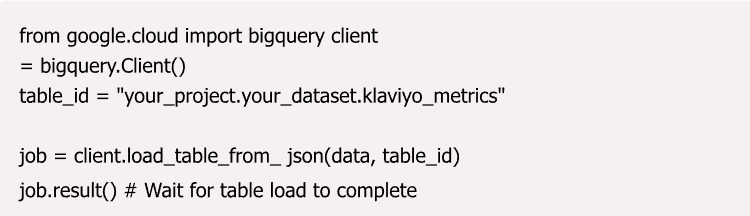
This lets you store your Klaviyo metrics alongside other datasets, making reporting and analysis a breeze.
Step 3: Querying & Visualizing with BigQuery & Looker Studio
Once data lands in BigQuery, write SQL queries to aggregate monthly metrics. For example, calculating average open rates per campaign:
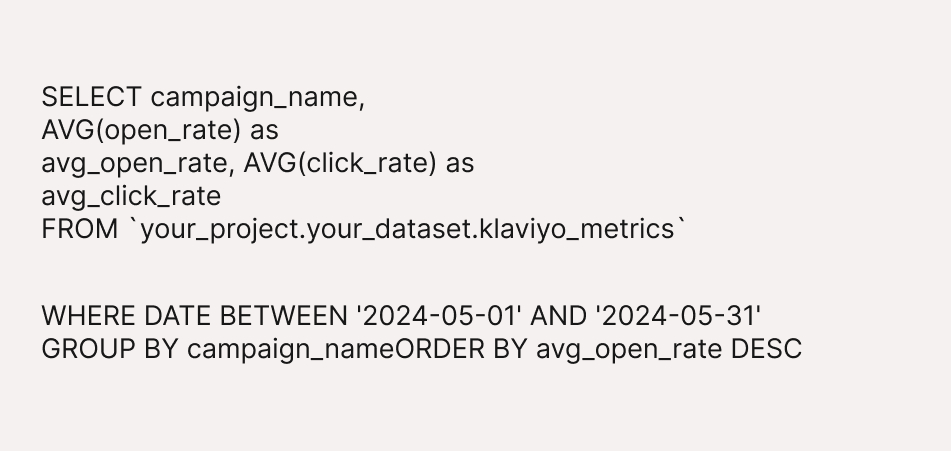
These results are then connected to Looker Studio (formerly Google Data Studio) to build clean, interactive dashboards that can be shared with stakeholders.
Step 4: Automating the Entire Workflow with Google Cloud Functions
To make all this truly hands-off, deploy your Python extraction and loading script as a Google Cloud Function that triggers monthly (using Cloud Scheduler). This way, every month your reports refresh automatically without lifting a finger.
Hereʼs a minimal Cloud Function code snippet that follows this workflow: def klaviyo_report(event, context):
import requests
from google.cloud import bigquery
# Extract data
API_KEY ‘your_klaviyo_api_key’
headers = {‘Authorization’: f’Bearer API_KEY’ url = ‘https://a.klaviyo.com/api/v1/metrics/timeline’ params = {‘page’: 0, ‘count’: 100, ‘sort’: ‘desc’}
response = requests.get(url, headers=headers, params=params) data = response.json()
# Load data into BigQuery
client = bigquery.Client()
table_ref = client.dataset(‘your_dataset’).table(‘klaviyo_metrics’) rows_to_insert = [
{‘event_name’: e[‘metric’][‘name’], ‘timestamp’: e[‘time’], ‘value’: e[‘value’]} for e in data[‘data’]
]
client.insert_rows_json(table_ref, rows_to_insert)
Tying this to Cloud Scheduler ensures it runs monthly. You can also configure Pub/Sub triggers, logging, and error notifications for smooth maintenance.
See the Impact: Real-World Advantages
Automating monthly reports with Python and BigQuery saves time, improves data accuracy, and delivers faster, more reliable business insights without manual effort.
In one of our case studies, a rapidly growing marketing team saved over 20 hours per month by automating newsletter and campaign report generation using this approach. Reports that once took days to prepare now refresh automatically on the first day of every month, without human intervention.
The practical impact becomes clear once reporting shifts from a manual task to a scheduled system.
Hereʼs a glimpse of the type of dashboard output:
- Monthly open and click rates broken down by campaign.
- Trendlines showing increases or declines.
- Automated alerts when key metrics dip below predefined targets.
Imagine those insights just landing in your inbox every month, no manual hassle required.
These advantages explain why automated reporting systems consistently outperform manual spreadsheet-based reporting across accuracy, speed, and scalability.
| Advantage | Description |
| Increased Data Reliability (Accuracy) | Eliminate human error from manual exports, copy-pasting, and formula mistakes. BigQuery performs consistent, reliable KPI calculations. |
| Speed and Timeliness | Reports are generated automatically at 3:00 AM on the 1st of the month, rather than days later, allowing teams to respond faster to performance changes. |
| Scalability and Customization | Easily integrate Klaviyo data with other sources (Shopify, Google Ads) in BigQuery for holistic reporting (e.g., calculating True CustomerLifetime Value, not just Email CLV). |
| Focus on Strategy, NotSpreadsheets | Frees up analyst time from repetitive data pulling (a massive time sink) to focus on deeper analysis, segmentation, and optimization. |
Cost Efficiency | For large datasets, BigQuery offers superior performance and often a better total cost of ownership than relying on local database servers or slow manual tools. |
In practice, these advantages translate into faster decisions, fewer data disputes, and a reporting system that scales as data volume and business complexity grow
Real-World Example: Our Marketing Website Case Study
The value of automation becomes most obvious when it is applied to real production reporting, where deadlines, data volume, and accuracy all matter at the same time. In these environments, manual workflows tend to break down quickly as complexity increases.
Across multiple projects, a consistent pattern emerges. Once reporting is automated, teams stop spending time validating numbers and start spending time acting on them. The reporting process shifts from a monthly operational burden to a dependable system that supports day-to-day decision-making.
Klaviyo Automation .Case Study 1
We recently helped a marketing team automate their monthly Klaviyo reports using a Serverless Data Pipeline built entirely on Google Cloud. Previously, the team spent valuable time compiling campaign metrics, website traffic, and conversion stats into a final spreadsheet that required heavy manual reconciliation.
The solution leveraged Google Cloud Functions (GCF) for orchestration and BigQuery for data processing.
Hereʼs a summary table of time saved and error rates before and after automation:
| Metric | Before Automation | After Automation (Cloud Functions) |
| Report Prep Time | 6 hours, 10 minutes | 10 minutes (Mostly BigQuery processing time) |
| Data Error Rate | 15% (Due to manual filtering/copying) | 1% (Attributable only to source API issues) |
| TeamSatisfaction | Medium | High |
| Pipeline Reliability | Low (Single analyst dependency) | Very High (Monitored by Cloud Monitoring) |
| MarketingInsight Quality | Static, Backward- Looking | Dynamic, Highly Optimized |
SaaS Subscription Marketing .Case Study 2
A rapidly growing SaaS company faced a different challenge: unifying subscription revenue data with marketing engagement data.
Before automation, the marketing team manually cross-referenced:
- Stripe subscription and revenue data
- Email engagement metrics from their marketing platform’s API
This process took nearly two full days every month. As a result, critical metrics like Revenue Per Subscriber (RPS) were calculated weeks after the reporting period closed. Decision-making was consistently delayed and based on outdated information.
The Serverless Pipeline: Unifying Financial and Marketing Data
To solve this, a Cloud Function–orchestrated pipeline was built to unify financial and marketing data inside BigQuery on a daily basis.
The pipeline consisted of three sequential Google Cloud Functions, triggered automatically by Cloud Scheduler:
- Function 1 (Stripe Extractor): Pulls raw subscription and billing data from the Stripe API (e.g., plan, renewal date, MRR).
- Function 2 (Marketing Platform Extractor): Pulls raw engagement and flow data from the marketing platform’s API (e.g., email opens, unsubscribes, flow enrollment).
- Function 3 (BigQuery Transformer): Executes a complex SQL join in BigQuery, matching subscribers across both datasets (using email as the unique identifier) to calculate the final RPS.
This integration enabled the marketing team to immediately see which marketing flows and campaigns were driving the highest-value, longest- retaining subscribers.
Results: Unlocking Real-Time RPS Insights
By automating the data integration and transformation, the team shifted from slow, static reporting to fast, accurate, and actionable daily insights:
| Metric | Before Automation | After Automation (Cloud Functions) |
| Subscription Data Prep Time | 16 hours (Manual API pulls & Excel reconciliation) | 15 minutes (Cloud Function execution) |
| Time to Calculate RPS | 3-4 days (Always lagged) | 1 hour (Available daily, real-time) |
| Data Error Rate | 8% (Mismatched join keys, stale subscription data) | 0.5% (Automated join logic in BigQuery) |
| Marketing Insight Quality | Limited to monthly snapshots | Dynamic; enabling daily A/B test analysis |
| Decision Velocity | Slow (Decisions based on two- week-old data) | High (Decisions based on yesterday’s data) |
Key Takeaways and Tips
Teams adopting automated reporting systems consistently see better results when they follow a few practical principles:
- Start small
Begin with a single dataset, such as Klaviyo email metrics, and automate that end to end before adding complexity. - Use cloud-native tools
BigQuery provides scalable storage and fast querying, while cloud functions and schedulers handle orchestration reliably. - Build in logging and monitoring
Logs and alerts ensure failures are detected early and pipelines remain trustworthy. - Iterate continuously
Automation is not set-and-forget. Pipelines should evolve as data sources, KPIs, and business needs grow.
Prerequisites and Setup Checklist
Automating monthly reports with Python and BigQuery requires a Google Cloud account, access to source APIs like Klaviyo, a Python runtime, and a service account with permissions to run jobs and write data to BigQuery.
Before implementing the automated reporting pipeline, a few technical and access-related prerequisites must be in place. These components ensure the system runs securely, reliably, and without manual intervention.
Google Cloud Platform (GCP) Account
The foundation of the automation setup is a Google Cloud Platform (GCP) account. All processing, storage, and scheduling happens inside this environment.
The following services should be enabled in the GCP project:
- BigQuery
Used as the central data warehouse for storing raw API data, running SQL transformations, and creating reporting-ready tables. - Google Cloud Functions
Used to execute Python scripts in a serverless environment on a fixed schedule.
This setup removes the need to manage servers while ensuring scalability and reliability.
Klaviyo Private API Key
Access to marketing data is handled through the Klaviyo Private API Key.
The API key should have read-only permissions for:
- Campaigns
- Metrics
- Flows
This allows secure extraction of email performance data such as open rates, clicks, and unsubscribes, without risking changes to Klaviyo configurations
Python Environment
Python is used for API communication and data loading.
Recommended setup:
- Python version: Python 3.x
- Required libraries:
- requests for interacting with APIs
- google-cloud-bigquery for loading data into BigQuery
- requests for interacting with APIs
Python scripts can be tested locally and then deployed to Cloud Functions for automated execution.
GCP Service Account and Permissions
Automated workflows require a Google Cloud Service Account to access cloud resources securely.
The service account should:
- Use a JSON key file for authentication
- Have permissions to:
- Execute Cloud Functions
- Create and update BigQuery tables
- Insert data into BigQuery datasets
- Execute Cloud Functions
Proper permission scoping ensures the pipeline runs without manual access and remains auditable.
Monitoring and Reliability Setup
To maintain trust in automated reporting, basic monitoring is recommended.
Common additions include:
- Cloud logging for function executions
- Error alerts for failed runs
- Retry logic for temporary API failures
These measures help detect issues early and ensure reports continue to run on schedule.
Frequently Asked Questions (FAQs)
Is BigQuery expensive for automated reporting?
BigQuery offers a generous free tier, which is sufficient for many automated reporting use cases. For larger datasets, pricing is based on the amount of data queried. Using optimized SQL that scans raw staging tables only once keeps BigQuery costs low when automating monthly reports.
Can I use this setup for Klaviyo Flow reports instead of Campaign reports?
Yes, This automated reporting setup works for both Klaviyo Campaigns and Flows. You only need to change the Klaviyo API endpoint in the Python extraction step from campaign-series-reports to flow-series-reports and adjust the payload to match flow-level metrics.
How do I handle incremental data loading in BigQuery?
Incremental data loading is handled by modifying the BigQuery SQL transformation step to append only records newer than the last successful run. This avoids truncating tables and supports long-term data warehousing. Orchestration tools like Apache Airflow or scheduler-based state tracking make this process reliable.
Why use Google BigQuery instead of a local database like PostgreSQL?
Google BigQuery is serverless, which means there is no infrastructure to manage. It automatically scales for large analytical workloads, delivers high query performance, and reduces maintenance overhead compared to local databases such as PostgreSQL, especially for marketing and analytics data.
How do I secure my marketing platform’s private API key in Google Cloud Functions?
API keys should be stored in Google Secret Manager, not hardcoded in Python scripts. The Cloud Function service account should be granted permission to access the secret at runtime, ensuring secure and auditable API key management.
What is the best way to handle API rate limiting during Python data extraction?
API rate limiting is best handled by implementing a retry mechanism with exponential backoff in Python. This approach retries failed API calls while waiting progressively longer between attempts (for example, 2s, 4s, 8s), allowing automated reporting pipelines to handle temporary API congestion safely.
Final Thoughts: Building a Scalable Automated Reporting System
A scalable automated reporting system is built by combining Python for data extraction, Google BigQuery for data storage and transformation, and cloud orchestration tools to run the pipeline on a fixed schedule. Once this foundation is in place, reporting becomes a reliable system instead of a recurring manual task.
This approach ensures consistency. Every report is generated using the same logic, definitions, and timing, which reduces data discrepancies and improves trust across teams. As data volume grows, the system continues to perform without increasing manual effort.
Over time, this foundation also makes it easier to extend reporting into forecasting, anomaly detection, and predictive analytics using the same BigQuery datasets.
Until then, happy automating. Feel free to share your questions or success stories in the comments. Learning together is how we grow.

January 3, 2026
Predictive Insights vs Trend Analysis: What Businesses Should...

January 3, 2026