Why Data Literacy Is Becoming a Must-Have Skill
Understanding What Data Literacy Really Means
Let’s be honest, data can be confusing. Numbers, charts, and reports are everywhere, and it is easy to feel lost. But here is the truth. You do not need to be a data scientist to make sense of it. What you need is data literacy, the ability to read, understand, and use data in a way that actually helps you make better decisions.
Think of data like a map. Without knowing how to read it, you might get lost or make a wrong turn. With data literacy, you can see the bigger picture, find the right path, and make smarter choices. Whether it is at work, running a small business, or managing personal projects, this skill is becoming more and more important every day.
What is data literacy
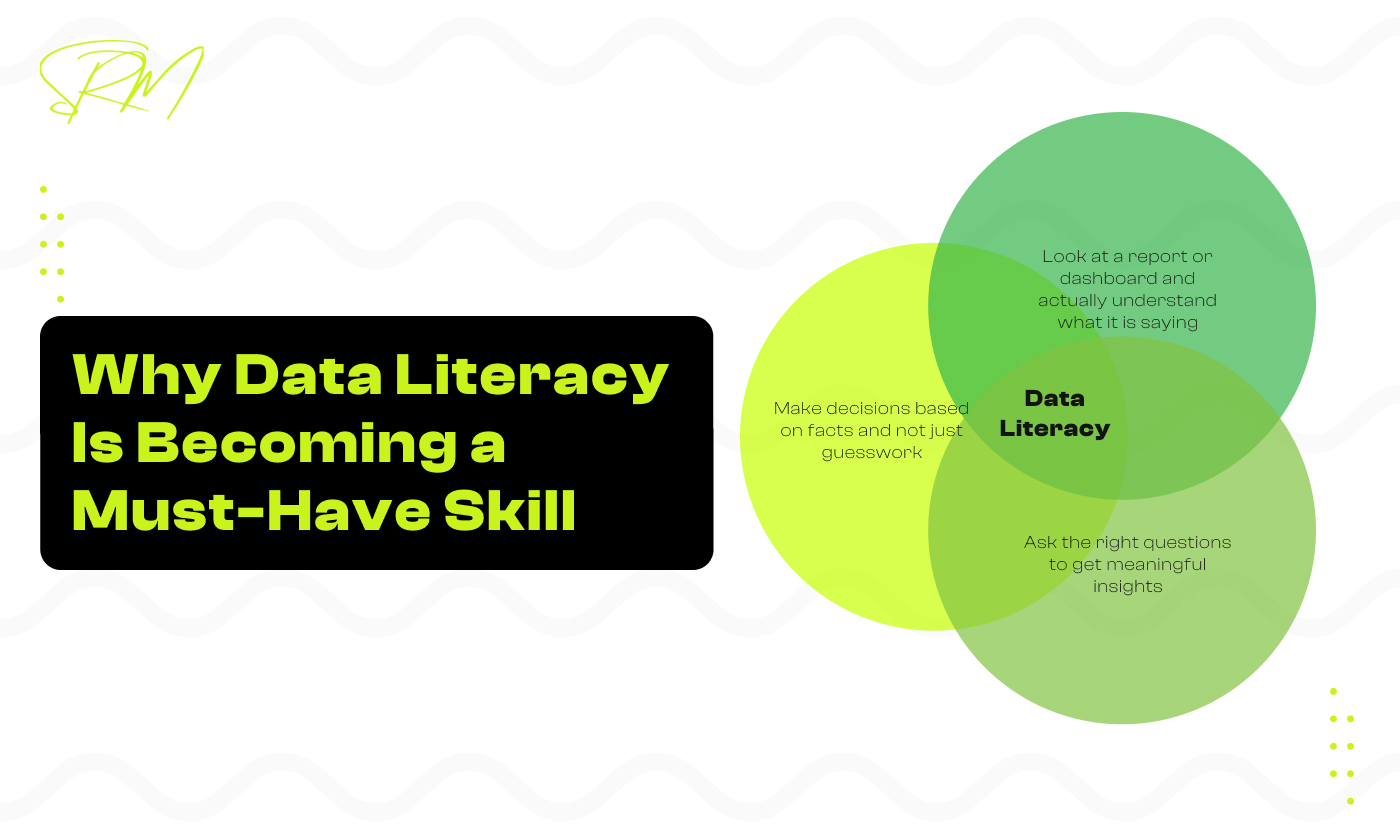
So, what exactly is data literacy? Simply put, it is your ability to understand numbers, charts, and insights and use them confidently.
When you are data-literate, you can:
- Look at a report or dashboard and actually understand what it is saying
- Ask the right questions to get meaningful insights
- Make decisions based on facts and not just guesswork
For example, imagine a marketing manager looking at a campaign report. Someone who is not data-literate might just see numbers and feel confused. But a data-literate manager can spot which campaigns are working, which are not, and what to do next, all without needing to be a data expert.
Data literacy is about turning raw numbers into real understanding. It is a skill that helps you make smarter decisions faster, and in today’s data-driven world, that is a superpower worth having.
Table of Contents
Why Data Is Now Part of Everyday Decision-Making
Data is no longer something only analysts or IT teams use. Today, it touches almost every aspect of business. From small day-to-day choices to big strategic decisions, data helps people make smarter, faster, and more confident decisions. Companies that embrace data in daily operations are often more agile, competitive, and ready to adapt to change.
In fact, data is no longer just a tool for measuring success after the fact. It is now a guide for planning and improving everyday operations. Teams can spot trends before they become problems, adjust strategies in real time, and even anticipate customer needs. This shift means that data is not just about numbers, it is about making better choices every day and creating a business that can respond quickly to changes in the market.
How businesses rely on data daily
Businesses rely on data in ways we might not always notice. Every department uses it to track performance, measure outcomes, and make decisions based on facts. For example:
- Sales teams monitor customer purchases to plan stock and promotions
- Operations track supply chains to avoid delays and reduce costs
- Customer support uses data to understand recurring issues and improve satisfaction
Even small decisions, like which email subject line gets better engagement or which supplier offers the best deal, are guided by data. Without it, companies would rely on guesswork, increasing the chance of mistakes and missed opportunities. Using data daily creates a culture of informed decision-making, where teams can act confidently and efficiently.
Examples of data in different departments (Marketing, HR, Finance)
Data is used in almost every part of a business to make decisions smarter and faster. It is not just about collecting numbers; it is about understanding what is happening and acting on it. Different departments use data in different ways, and each team benefits from it to improve performance and results.
- Marketing: Data shows which campaigns bring in more leads, which posts get the most engagement, and which channels generate the best return on investment. It helps marketers plan strategies that actually work, instead of hoping for results.
- HR: Human resources teams track employee performance, retention rates, and engagement surveys. Data helps managers understand team dynamics, plan training programs, and make better hiring decisions.
- Finance: Finance teams analyze sales trends, expenses, and budgets. Data supports accurate forecasting, cost control, and investment decisions. It ensures that financial planning is based on reality, not assumptions.
The impact of data goes beyond just generating reports. It allows teams to see patterns, detect potential problems early, and act on opportunities before competitors do. Businesses that use data effectively in every department are more likely to make informed, proactive decisions rather than reactive ones. In fact, data is no longer just a tool for measuring success after the fact. It is now a guide for planning and improving everyday operations. Teams can spot trends before they become problems, adjust strategies in real time, and even anticipate customer needs. This shift means that data is not just about numbers, it is about making better choices every day and creating a business that can respond quickly to changes in the market.
Why ignoring data can lead to wrong decisions
Ignoring data may feel easier at times, but it can be costly. Decisions based only on intuition or past experience may seem logical, but they often lead to:
- Wasting money on marketing campaigns that do not bring results
- Hiring the wrong people or promoting employees who are not ready
- Missing emerging trends or new market opportunities
For example, a company that ignores customer feedback data may continue selling a product that no longer meets demand, losing market share to competitors. Data provides evidence to support decisions, reducing risks and improving outcomes. In short, businesses that use data effectively are more likely to grow steadily, while those that ignore it may struggle.
Common myths about data
Many people avoid using data because of misunderstandings. Here are a few common myths:
- Data is too complicated to understand – You do not need to know everything about data to use it. Even basic knowledge helps in interpreting insights correctly.
- You must be a data expert – Most roles only require enough skill to understand reports and dashboards and make informed decisions.
- Data tells you everything – Data is a tool, not a crystal ball. It helps you make better decisions but does not replace human judgment.
- Only analysts or IT teams should use data – Everyone benefits from understanding data, from managers to frontline employees.
Breaking these myths encourages people to start using data confidently, which improves decision-making across the organization.
The Growing Gap Between Data and People
Having access to data does not automatically mean it is being used effectively. Many organizations collect mountains of information, but a lack of understanding prevents teams from turning it into meaningful insights. This creates a gap between the data available and the people who need it to make decisions. Closing this gap is critical for any business that wants to stay competitive in today’s fast-moving environment.
Why having data is not enough
Simply collecting data is only the first step. Without knowing how to read it, analyze it, and apply it, data is just numbers on a screen. Many businesses assume that storing information in reports, dashboards, or spreadsheets is enough. However, if employees do not know how to interpret it, decisions are still based on guesswork or intuition. Data only becomes valuable when people can understand what it is saying and use it to guide action.
Challenges of low data literacy
Low data literacy is becoming a big hurdle for many organizations. Even with access to reports and dashboards, employees may struggle to understand what the data is really saying. This can lead to confusion, mistakes, and missed opportunities across teams.
Low data literacy creates several challenges for organizations:
- Employees may feel overwhelmed or confused by complex reports
- Teams may misinterpret data trends or miss important patterns
- Managers might rely too much on gut feeling instead of evidence
- Collaboration suffers because different teams cannot communicate insights effectively
These challenges can slow down decision-making, create errors, and prevent companies from fully leveraging the insights data provides.
Common mistakes in interpreting data
When data literacy is low, common mistakes often occur:
- Overgeneralizing: Drawing conclusions from incomplete or small datasets
- Ignoring context: Making decisions without understanding the full story behind the numbers
- Focusing on the wrong metrics: Tracking metrics that do not actually indicate success
- Misreading trends: Mistaking normal fluctuations for meaningful changes
Such mistakes can lead to poor decisions and missed opportunities. Even powerful analytics tools cannot prevent errors if people do not understand the data correctly.
How organizations suffer from the gap
When employees cannot understand or use data effectively, it creates a disconnect that affects the entire organization. Decisions may be delayed, mistakes may increase, and opportunities can be missed. The gap between data and people can weaken performance, reduce efficiency, and limit growth.
The gap between data and people can hurt businesses in many ways:
- Lost revenue opportunities: Decisions based on incorrect insights may lead to failed campaigns or wasted resources
- Inefficient processes: Teams may duplicate work or overlook areas that need improvement
- Decreased employee confidence: Employees may avoid using data altogether if they feel they cannot interpret it correctly
- Competitive disadvantage: Companies that cannot leverage data effectively may fall behind competitors who use it well
Closing this gap is essential. Businesses that invest in building data literacy across their teams are able to unlock the full potential of their data, make smarter decisions, and respond faster to changes in the market.
How Data Literacy Supports Data Analytics
Data literacy is the key that allows businesses to turn raw data into actionable insights. Without it, even the most advanced analytics tools cannot help organizations make better decisions. When teams understand data, they can analyze trends, uncover hidden patterns, and make decisions that drive growth.
When employees are data-literate, they can see beyond the numbers. They understand what the data is really showing, can identify opportunities before competitors do, and can solve problems faster. This skill not only improves individual performance but also helps the entire organization make smarter, faster, and more confident decisions based on evidence rather than guesswork.
Turning raw data into meaningful insights
Raw data by itself is just numbers, lists, or records. It does not tell a story until someone interprets it correctly. Data literacy allows professionals to transform this raw information into meaningful insights that can guide business actions.
Step by step, this process works like this:
- Collect data – Gather information from sources such as sales reports, customer feedback, or website analytics.
- Clean data – Remove errors, duplicates, or irrelevant information to make the data reliable.
- Analyze patterns – Look for trends, correlations, or unusual behavior that can reveal opportunities or problems.
- Interpret results – Translate numbers into actionable insights by asking what the data is really showing.
- Share insights – Communicate findings through dashboards, reports, or presentations so decisions can be made effectively.
This approach ensures that data is not just collected, but actually used to make smarter decisions.
Asking the right questions
Data analytics is not just about looking at numbers; it is about asking the right questions to find useful answers. Data-literate professionals know how to focus on the most important issues rather than getting lost in irrelevant details.
Some ways to ask the right questions include:
- Start with the business goal: What problem are we trying to solve?
- Focus on outcomes: What action should this data help us take?
- Compare trends: Are there patterns over time that matter?
- Break it down: Can we segment data by region, product, or customer group to get clearer insights?
Asking thoughtful questions ensures that analytics leads to meaningful conclusions rather than confusion.
Making informed business decisions
When teams are data-literate, they can use insights to make decisions confidently and efficiently. Instead of relying on guesswork or assumptions, they can identify opportunities, anticipate challenges, and prioritize actions that drive results.
For example, a sales team can see which products are underperforming and adjust strategies quickly. A marketing team can focus on campaigns that deliver the best return. In every case, data literacy bridges the gap between information and action, allowing organizations to achieve better outcomes consistently.
The Role of Data Literacy in Data Visualization
Data visualization is one of the most powerful ways to make sense of complex data. Charts, graphs, and dashboards can turn numbers into clear stories that anyone can understand. But without data literacy, even the most visually appealing charts can be confusing or misleading. When people know how to interpret visuals correctly, they can quickly spot trends, identify issues, and make smarter decisions.
Data-literate teams not only understand what the data shows, but they also know how to use visualization to communicate insights effectively. They can spot patterns, compare performance over time, and present information in a way that helps others understand it. This makes decision-making faster, more accurate, and more collaborative across the organization.
Understanding charts, graphs, and dashboards
To use data visualization effectively, it’s important to understand the different types of visuals:
- Charts: These include bar charts, line charts, and pie charts. They help show comparisons, trends, and proportions in an easy-to-read format. For example, a bar chart can show monthly sales for different products, while a line chart can show sales trends over time.
- Graphs: Graphs are often used to show relationships between variables. A scatter plot, for instance, can reveal correlations between marketing spend and customer acquisition.
- Dashboards: Dashboards combine multiple charts, graphs, and metrics into one interactive view. They provide a snapshot of key business performance and allow teams to monitor progress and make quick decisions.
Understanding each type of visual helps teams interpret data accurately and ensures that insights are not lost in confusing or poorly designed visuals.
To get the most out of data visualization, it’s also important to understand the key terms and concepts behind charts, graphs, and dashboards. Knowing these terms helps you interpret visuals correctly and communicate insights clearly. You can learn more in our guide that explains essential data visualization terminology for analysts, which breaks down the most important concepts every professional should know. This knowledge ensures your visualizations are accurate, effective, and easy for others to understand.
Avoiding misinterpretation of visual data
Even simple visuals can be misleading if they are not read carefully. Data literacy helps people avoid common mistakes such as:
- Assuming correlation means causation
- Misreading axes or scales on charts
- Focusing on the wrong metrics
- Ignoring context or external factors
By being aware of these pitfalls, teams can trust the data and use it to guide decisions confidently, rather than drawing the wrong conclusions from what looks like simple charts.
Using visualization to tell a story
Data visualization is more than just showing numbers, it is about telling a story. A well-designed visual can highlight trends, explain relationships, and guide decision-making. For instance, instead of showing raw sales data for every region, a heat map can immediately highlight areas that are performing well or need attention.
Effective storytelling with visuals requires understanding the audience and choosing the right type of visual for the message. For example, executives may prefer dashboards with summary metrics, while analysts may need detailed charts for deeper insights.
When data tells a story clearly, it makes it easier for teams to act, align on priorities, and communicate findings across departments. Visualization becomes a bridge between raw data and actionable insights, helping people see patterns and opportunities that would otherwise remain hidden.
Communicating insights effectively
Presenting visuals is only one part of the process; communicating insights effectively is equally important. Data-literate professionals can explain what the visuals mean, why they matter, and what actions should be taken.
This involves:
- Highlighting key takeaways without overwhelming the audience with too much detail
- Using clear, simple language to explain trends and patterns
- Connecting insights to real business decisions or goals
Effective communication ensures that data drives action, not just discussion. When teams understand the insights and their implications, they can make informed, evidence-based decisions that improve performance and outcomes.
Why Data Literacy Is a Must-Have Skill for Modern Careers
In today’s data-driven world, being able to understand and use data is no longer optional. Professionals across industries are expected to make decisions based on facts, spot trends, and communicate insights clearly. Data literacy helps people not just survive but thrive in modern workplaces, giving them a competitive edge in their careers.
Whether you are a team leader, a manager, or an individual contributor, understanding data allows you to contribute more effectively to your organization, make smarter decisions, and even influence strategy. It is a skill that benefits both personal growth and overall business success.
Benefits for professionals and leaders
In today’s workplace, professionals and leaders are expected to make decisions quickly and accurately. Data literacy gives them the tools to understand trends, evaluate performance, and identify opportunities. It empowers individuals to contribute more effectively, influence strategy, and make decisions that are backed by evidence rather than guesswork.
Data literacy provides several advantages for professionals and leaders:
- Better decision-making: Being able to read and interpret data helps you make informed choices rather than relying solely on intuition.
- Increased credibility: Leaders who base decisions on data earn more trust from their teams and stakeholders.
- Career growth: Professionals with data skills are in higher demand across almost every industry.
- Improved problem-solving: Understanding data allows you to spot issues early, identify solutions, and act quickly.
By developing data literacy, professionals can stand out as problem-solvers and strategic thinkers, making themselves invaluable in any organization.
How data-literate teams perform better
Teams that are data-literate can collaborate more effectively and achieve better results. When everyone understands how to interpret data:
- Decisions are faster and more accurate
- Strategies are based on evidence, not assumptions
- Resources are used efficiently, reducing waste
- Teams can anticipate challenges and adapt quickly to changes
Data-literate teams drive higher performance, achieve goals more reliably, and stay ahead of the competition. Organizations that invest in building data literacy across all employees create a culture of informed decision-making that benefits everyone.
How to Start Building Data Literacy Skills
Building data literacy may seem overwhelming at first, but it doesn’t have to be. Like any skill, it starts with small, consistent steps. Learning to understand and use data effectively can improve decision-making, boost confidence, and make you a valuable asset to any team.
By developing these skills gradually, you can turn raw numbers into insights, ask the right questions, and make smarter decisions every day.
Start with simple data exercises
The easiest way to begin is with small, practical exercises. Look at everyday data around you, like sales numbers, website traffic, or customer feedback. Try to identify patterns, trends, or outliers. Even basic exercises, such as calculating averages or percentages, can build confidence and help you start thinking analytically.
Starting small allows you to practice without feeling overwhelmed, and as you gain confidence, you can gradually tackle more complex datasets. The key is consistency, spending a little time every day with data helps build intuition and comfort over time.
Use dashboards and visualization tools
Interactive dashboards and visualization tools make it easier to understand data. Tools like Google Data Studio, Tableau, or Power BI allow you to see trends and relationships clearly. Explore these dashboards, filter the data, and practice interpreting what each chart or graph is showing. This hands-on approach reinforces your understanding and helps you connect numbers to real-world insights.
Regular use of these tools also teaches you to ask better questions about the data and notice insights that might not be obvious at first glance. Over time, dashboards become not just a reporting tool, but a way to explore, experiment, and learn from data.
Take online courses or workshops
There are many courses and workshops designed to teach data literacy skills at any level. You can find beginner-friendly programs that cover topics like data analysis, Excel, SQL, and data visualization. Even dedicating 30–60 minutes a day to learning can make a big difference over time.
These courses also provide structured guidance and hands-on exercises to apply your skills, which accelerates learning. Pairing lessons with practice on your own data or company reports makes the learning more practical, relevant, and immediately useful in real-world situations.
Practice interpreting real-world data
The best way to get better is by practicing with real-world data. Analyze reports, public datasets, or your company’s performance metrics. Try to draw conclusions, identify trends, and suggest actions based on your findings. The more you practice, the more confident you will become in reading data accurately and using it to guide decisions.
Working with real-world data also helps you understand context and nuance, which is often missing in textbook exercises. You begin to notice the small details that matter, like seasonal trends, anomalies, or external factors, which makes your insights far more accurate and actionable.
Encourage data-driven thinking in your team
Data literacy is not just an individual skill, it improves team performance too. Encourage colleagues to look at data when making decisions, ask questions, and share insights. Promote a culture where data guides discussions rather than opinions alone. Over time, this mindset helps teams make faster, smarter, and more consistent decisions across the organization.
By fostering data-driven thinking, teams also learn from each other. Sharing interpretations, debating insights, and collaborating on data-driven projects helps everyone grow their skills while building a stronger, more informed team culture.
Frequently Asked Questions (FAQs)
What is data literacy and why is it important?
Data literacy is the ability to read, understand, and use data effectively. It helps professionals and teams make informed decisions, spot trends, and solve problems confidently. In today’s data-driven world, it is becoming a critical skill for success in almost every industry.
Do I need to be a data expert to become data-literate?
Not at all! You don’t need to be a data scientist. Basic skills like understanding charts, analyzing trends, and asking the right questions are enough to start making better decisions with data. Data literacy is about applying insights, not memorizing numbers.
How can I start improving my data literacy?
You can start small by practicing with simple data exercises, exploring dashboards, taking beginner-friendly courses, and interpreting real-world data. Over time, these habits build confidence and help you make data-driven decisions.
How does data literacy help teams perform better?
When a team understands data, decisions are faster, more accurate, and based on evidence rather than guesswork. Teams can spot opportunities early, coordinate better, and communicate insights clearly, which leads to higher performance and more reliable results.
Can data literacy really impact my career growth?
Yes! Professionals with data literacy are in high demand because they can make informed decisions, solve problems efficiently, and guide strategy. It helps you stand out as a confident, results-driven team member or leader.
Conclusion
Data literacy is no longer just a “nice-to-have” skill. It has become essential for anyone who wants to make smarter decisions, advance their career, and help their organization succeed. From understanding charts and dashboards to interpreting trends and asking the right questions, being data-literate allows you to turn raw numbers into meaningful insights.
Whether you are a professional, a team leader, or part of a larger organization, developing data literacy helps you work more confidently, collaborate better, and act based on evidence rather than guesswork. The good news is that it is a skill anyone can build with consistent practice, simple exercises, and the right mindset.
As more organizations rely on data to guide strategy and daily decisions, professionals who understand how to interpret and use data are in higher demand. Data literacy not only improves individual performance but also contributes to a stronger, more informed team and a more competitive organization.
By starting small, practicing regularly, and embracing a data-driven approach, you can transform the way you make decisions. Learning to read, analyze, and communicate insights effectively empowers you to see opportunities, solve problems, and drive results in both your career and your organization.
January 12, 2026
What Is Server-Side Tracking? Examples, Benefits, and Your...

January 12, 2026