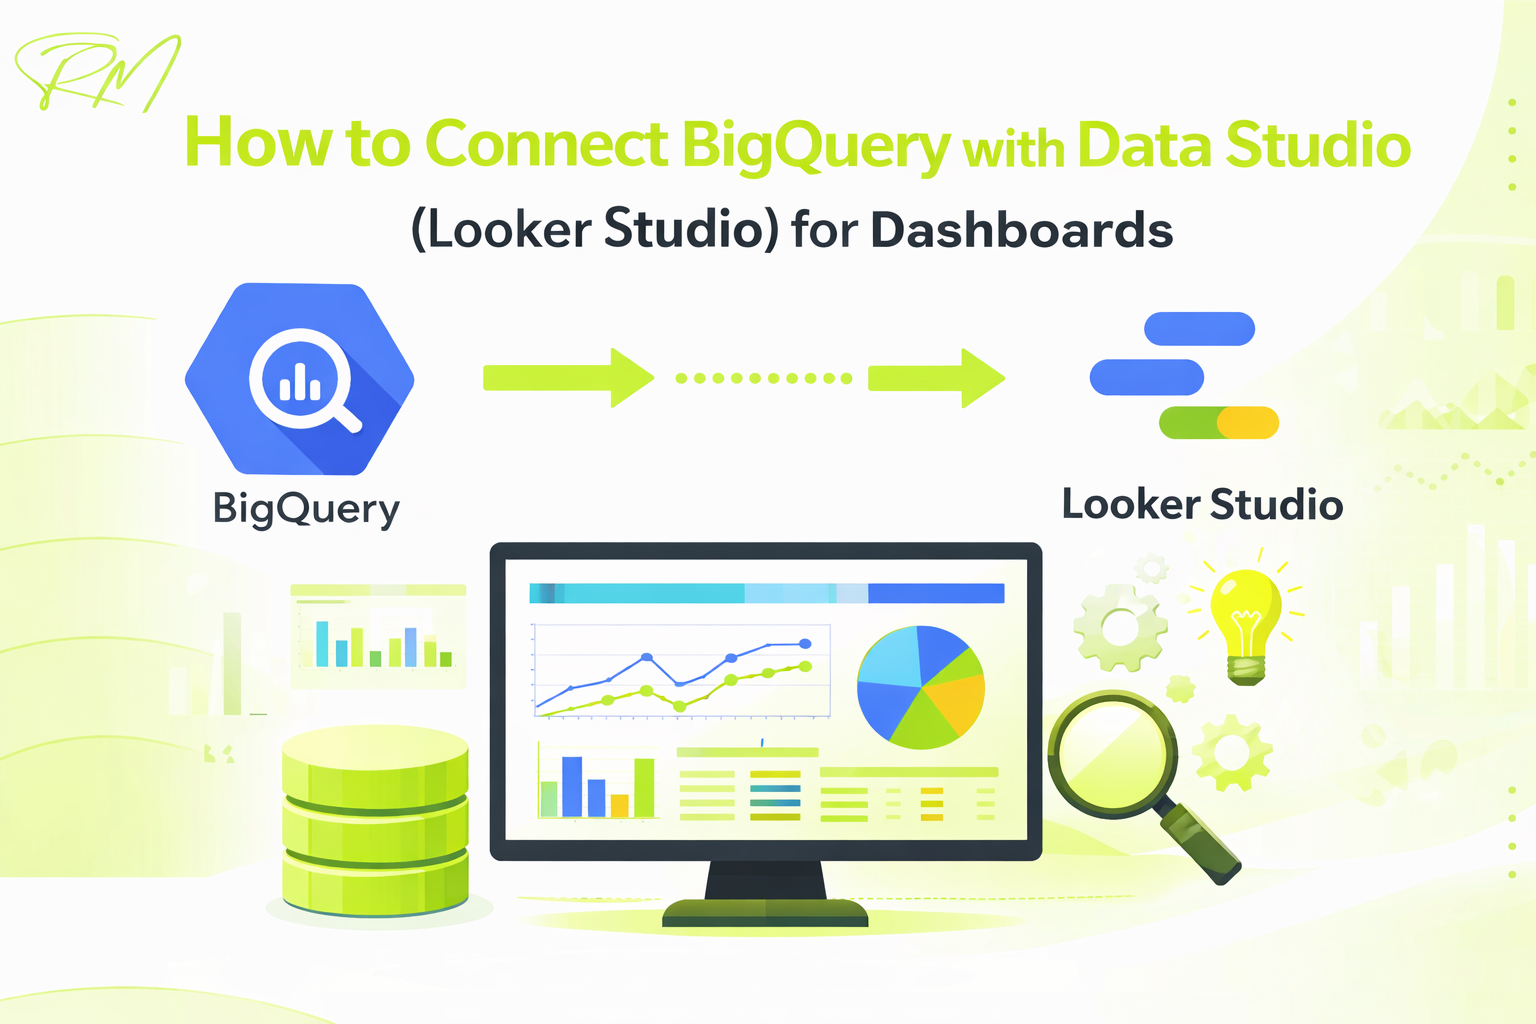
How to Connect BigQuery with Data Studio (Looker Studio) for Dashboards
Table of Contents
Overview of BigQuery and Looker Studio
Modern businesses generate massive volumes of data from websites, apps, marketing platforms, and internal systems. Turning this raw data into meaningful insights requires both a powerful data warehouse and an intuitive visualization tool. This is where Google BigQuery and Looker Studio work together.
BigQuery handles large scale data storage and analytics, while Looker Studio transforms that data into interactive dashboards and reports. When connected, they allow teams to move from raw data to actionable insights without complex infrastructure or heavy maintenance.
What is Google BigQuery
Google BigQuery is a fully managed, serverless data warehouse designed to analyze large datasets quickly using SQL. It is built to handle billions of rows of data without requiring users to manage servers, storage, or performance tuning.
BigQuery is commonly used for:
- Storing event level data from websites and applications
- Analyzing marketing, product, and user behavior data
- Running complex analytical queries at scale
- Supporting real time and near real time reporting
Because BigQuery separates storage and compute, it allows businesses to scale analysis efficiently while paying only for the data processed. This makes it ideal for growing organizations that need fast insights without operational overhead.
What is Looker Studio (formerly Data Studio)
Looker Studio is Google’s free data visualization and reporting tool that helps teams create interactive dashboards from multiple data sources. It enables users to present data in a visual and shareable format without advanced technical skills.
With Looker Studio, you can:
- Build real time dashboards using charts, tables, and scorecards
- Connect data from BigQuery, Google Analytics, Google Ads, and more
- Apply filters, date ranges, and calculated fields
- Share dashboards securely with stakeholders
The tool is designed for collaboration, making it easy for marketing teams, analysts, and decision makers to access insights from a single source of truth.
Why Use BigQuery with Looker Studio for Dashboards
Connecting BigQuery with Looker Studio creates a powerful analytics stack that combines scalability with simplicity. BigQuery manages and processes large datasets efficiently, while Looker Studio turns those results into easy to understand dashboards.
Key reasons to use them together include:
- Faster dashboard performance even with large datasets
- Ability to use SQL for advanced data preparation
- Centralized and reliable data for reporting
- Real time or near real time insights for better decisions
- Cost effective analytics without complex setup
This combination is especially useful for teams that need accurate, scalable dashboards for marketing performance, product analytics, finance reporting, or operational monitoring.
Benefits of Connecting BigQuery to Looker Studio
Integrating BigQuery with Looker Studio creates a strong analytics foundation for businesses that work with large and growing datasets. Instead of managing separate systems for storage and reporting, this combination allows data to flow seamlessly from raw storage to visual dashboards. The result is faster insights, better performance, and more reliable decision making.
This setup is widely used by data teams, marketers, and product analysts who need scalable reporting without compromising speed or accuracy.
Real Time and Scalable Reporting
BigQuery is built to handle massive volumes of data while maintaining performance. When connected to Looker Studio, it enables dashboards that can grow as your data grows, without requiring major changes to your reporting setup.
With frequent data updates or streaming data, dashboards can reflect near real time information. This is especially useful for monitoring website traffic, marketing campaigns, user behavior, or operational metrics. As data volume increases, BigQuery automatically scales in the background, ensuring reports remain stable and accurate over time.
Faster Dashboard Performance
Dashboard performance is a common challenge when working with large datasets. BigQuery addresses this by executing heavy data processing at the warehouse level before results are passed to Looker Studio.
This approach reduces the amount of data that needs to be loaded into reports, leading to faster load times and smoother interactions. Filters, date selectors, and visual elements respond quickly, even when dashboards are built on millions or billions of rows. This improves usability and encourages teams to rely on dashboards for daily decision making.
Advanced Analysis with SQL Powered Data
One of the biggest advantages of using BigQuery is its support for standard SQL. This allows teams to prepare, clean, and transform data before it is visualized in Looker Studio.
With SQL, you can create advanced metrics, handle complex calculations, and combine data from multiple sources into a single reporting layer. Instead of performing calculations inside dashboards, logic can be defined in queries or views, making reports easier to maintain and more consistent across teams.
This separation of data logic and visualization leads to cleaner dashboards and more accurate insights.
Cost Efficiency for Large Datasets
BigQuery follows a usage based pricing model, where you pay for storage and the amount of data processed by queries. This makes it a cost effective solution for analytics at scale, especially compared to maintaining traditional data infrastructure.
When BigQuery is used as the primary data source for Looker Studio, there is no need to duplicate data across multiple tools. Query optimization, partitioning, and scheduled processing can further reduce costs while maintaining high performance.
For organizations working with large datasets, this combination offers a balanced approach to cost control and analytical power.
Prerequisites Before Connecting BigQuery to Looker Studio
Before connecting BigQuery to Looker Studio, it is important to ensure that the necessary setup and permissions are in place. Proper configuration helps prevent access errors, missing data issues, and performance problems later when building dashboards.
Having a clear understanding of your data structure and reporting requirements before starting the connection is equally important. Knowing which datasets and tables will be used, the type of metrics you want to track, and the expected frequency of updates will make the integration process smoother and more efficient. This planning also helps avoid unnecessary queries that can increase costs or slow down dashboard performance.
It is also crucial to verify that your Google Cloud environment is organized and that roles are assigned correctly. This includes making sure that the right team members have access to the necessary datasets without granting excessive permissions. A well-defined access structure not only improves security but also ensures that dashboards remain accurate and consistent across different users and departments.
Google Cloud Project Setup
BigQuery operates within a Google Cloud project, so the first requirement is having an active project in Google Cloud Platform. This project acts as the container for your datasets, billing, and access controls.
Make sure that:
- A Google Cloud project is created and active
- Billing is enabled for the project
- The BigQuery API is enabled
Without billing enabled, BigQuery will not allow query execution, even if datasets exist. Enabling the BigQuery API ensures that external tools like Looker Studio can access data from the project.
BigQuery Dataset and Tables
To build dashboards, you need at least one dataset and table available in BigQuery. These datasets store the data that Looker Studio will visualize.
Before connecting, confirm that:
- The dataset exists within the selected Google Cloud project
- Tables contain data and are updated as expected
- Table schemas are well structured with clear field names and data types
Well organized datasets make dashboard creation easier and reduce the need for complex transformations later. For advanced use cases, you may also create views or materialized views to simplify reporting and improve performance.
Required Permissions and Access Roles
Access permissions are one of the most common causes of connection issues between BigQuery and Looker Studio. The Google account used in Looker Studio must have appropriate permissions to read data from BigQuery.
At a minimum, the user should have:
- BigQuery Data Viewer role for the dataset
- BigQuery Job User role to run queries
If the user needs to create views or manage datasets, additional roles may be required. Permissions can be granted at the project, dataset, or table level, depending on security requirements.
Proper role assignment ensures secure access while preventing unauthorized data changes.
Looker Studio Account Requirements
Looker Studio is accessible using a Google account, and no paid subscription is required for standard reporting features. The same Google account should ideally be used for both BigQuery and Looker Studio to simplify authentication.
Before connecting, ensure that:
- You can log in to Looker Studio successfully
- Your account has access to the relevant Google Cloud project
- You have permission to create and edit reports
Once these requirements are met, Looker Studio can authenticate directly with BigQuery and allow you to select datasets and tables during the connection process.
Step by Step Process to Connect BigQuery with Looker Studio
Connecting BigQuery with Looker Studio is a straightforward process when the prerequisites are properly configured. This section walks through each step in detail, helping you move from an empty report to a fully connected data source ready for dashboard creation.
It also helps establish a consistent data flow between your warehouse and reporting layer. Once the connection is set up correctly, dashboards automatically reflect updates in BigQuery without manual exports or data refreshes. This ensures that stakeholders always work with the latest available data, reducing reporting delays and minimizing the risk of decision making based on outdated information.
By following these steps carefully, you can avoid common connection issues and ensure your dashboards are accurate and reliable.
Opening Looker Studio and Creating a New Report
Start by opening Looker Studio in your browser and signing in with the Google account that has access to your BigQuery project. Once logged in, you will see the Looker Studio homepage with options to create new reports and data sources.
Click on the option to create a new report. Looker Studio will prompt you to add a data source before the report can be created. This is where you begin the connection process. Creating a new report first allows you to immediately visualize data once the connection is complete.
Selecting BigQuery as a Data Source
After choosing to add a data source, Looker Studio will display a list of available connectors. From this list, select BigQuery as your data source.
BigQuery is a native Google connector, which means it integrates directly with Looker Studio without the need for third party tools. Once selected, Looker Studio will attempt to access your Google Cloud projects linked to the logged in account.
If this is your first time connecting to BigQuery, you may be asked to grant access permissions at this stage.
Choosing Project, Dataset, and Table
When connecting BigQuery to Looker Studio, you must select the correct project, dataset, and table. Each level plays a specific role in how your data is stored, accessed, and visualized. Choosing them carefully ensures accurate reporting and better dashboard performance.
Google Cloud Project
The Google Cloud project is the top level container that holds your BigQuery resources, billing settings, and access controls. When you select a project in Looker Studio, you are defining where the data connection will originate.
Make sure you choose the project that:
- Contains the required BigQuery datasets
- Has billing enabled
- You have permission to access
Selecting the wrong project may result in missing datasets or access errors, even if the data exists elsewhere.
Dataset
A dataset in BigQuery is a logical grouping of tables. Datasets are often organized by business function, application, or data source, such as marketing data, product analytics, or financial reporting.
When choosing a dataset:
- Ensure it contains the tables needed for your dashboard
- Check that the dataset is regularly updated
- Confirm that the dataset location aligns with your reporting needs
Well organized datasets make it easier to manage permissions and maintain consistent reporting.
Table
Tables store the actual data that Looker Studio will visualize. This is the most important selection, as it directly affects dashboard structure, metrics, and performance.
Before selecting a table:
- Review the table schema to confirm field names and data types
- Check for date fields required for time based analysis
- Ensure the table does not contain unnecessary or duplicate data
Choosing the right table reduces the need for complex transformations later and helps dashboards load faster and remain easy to maintain.
Using Custom SQL Queries (Optional)
Instead of selecting a table directly, you can choose to use a custom SQL query. This option is useful when you need to filter data, join multiple tables, or calculate metrics before the data reaches Looker Studio.
With custom SQL, you can define exactly what data is returned by BigQuery. This helps reduce data volume, improve dashboard performance, and ensure consistent calculations across reports. Once the query is validated, Looker Studio treats the query result as a virtual table for visualization.
For complex dashboards, using SQL at this stage often leads to cleaner and more maintainable reports.
Authorizing Access and Finalizing the Connection
After selecting the table or validating the custom SQL query, Looker Studio will request authorization to access the data. Review the permissions and confirm access.
Once authorized, the data source will be added to your report. You can now start building charts, tables, and filters using BigQuery data. The connection remains active, meaning dashboards will update automatically as new data becomes available in BigQuery.
At this point, the integration is complete and your report is ready for customization and visualization.
Creating Dashboards Using BigQuery Data
Once BigQuery is successfully connected to Looker Studio, the next step is transforming raw data into meaningful dashboards. Looker Studio provides flexible visualization and interaction options that allow you to explore data, monitor performance, and communicate insights effectively.
A well designed dashboard focuses on clarity, usability, and relevance. Choosing the right charts, applying filters, and structuring calculations properly ensures that your dashboards support accurate and informed decision making.
Adding Charts and Visualizations
Looker Studio offers a wide range of charts and visualization types that work seamlessly with BigQuery data. These include scorecards, tables, time series charts, bar charts, pie charts, and geo maps.
When adding charts:
- Match the chart type to the data being displayed
- Use time series charts for trends over time
- Use tables for detailed breakdowns and comparisons
- Use scorecards for key metrics and KPIs
Each chart pulls data directly from BigQuery, allowing it to scale efficiently even with large datasets. Thoughtful visualization choices make dashboards easier to interpret and more actionable.
Applying Filters and Date Range Controls
Filters and date range controls allow users to interact with dashboards and focus on specific segments of data. Looker Studio enables you to add filters at both the chart and report level.
Common use cases include:
- Filtering data by region, device, or user type
- Applying date ranges to analyze performance over specific periods
- Allowing viewers to explore metrics dynamically
Date range controls are especially important when working with BigQuery, as they limit the amount of data queried. This improves dashboard performance and helps control query costs while keeping reports responsive.
Using Calculated Fields
Calculated fields allow you to create custom metrics directly within Looker Studio without modifying the underlying BigQuery tables. These fields are useful for building ratios, percentages, and derived values needed for reporting.
Examples include:
- Conversion rates
- Average revenue per user
- Growth percentages
Calculated fields make dashboards more flexible, but they should be used carefully. For complex logic or heavy calculations, it is often better to define metrics in BigQuery using SQL to improve performance and maintain consistency across reports.
Blending BigQuery Data with Other Sources
Looker Studio allows you to blend BigQuery data with other data sources such as Google Analytics, Google Ads, or spreadsheets. This enables more comprehensive reporting by combining multiple datasets into a single dashboard.
Data blending is useful when:
- Comparing marketing performance with backend data
- Enriching BigQuery data with external attributes
- Creating unified views across platforms
To ensure accuracy, blended data should share common join keys and compatible data structures. While blending adds flexibility, keeping BigQuery as the primary data source helps maintain performance and reliability.
Best Practices for BigQuery Looker Studio Dashboards
Following best practices is essential when building dashboards with BigQuery and Looker Studio. As data volumes grow, poorly optimized dashboards can become slow, expensive, and difficult to maintain. Applying the right strategies from the beginning helps ensure that dashboards remain scalable, cost efficient, and easy for users to understand.
In addition to performance and cost considerations, best practices also help maintain data consistency and trust across teams. When dashboards are built using standardized queries, clear data definitions, and thoughtful design, stakeholders are more likely to rely on them for decision making. This reduces confusion, minimizes manual reporting efforts, and ensures that insights remain accurate as the organization and its data needs evolve.
Optimizing SQL Queries for Performance
SQL queries are the foundation of dashboard performance when using BigQuery as a data source. Queries should be written to return only the data required for reporting, rather than pulling entire tables. Filtering data early in the query and aggregating results before they reach Looker Studio significantly reduces processing time. Creating views or materialized views for commonly used logic also helps improve performance and keeps dashboards responsive even as data grows.
Reducing Data Scan Costs
BigQuery charges based on the amount of data processed by queries. Dashboards that scan large volumes of data frequently can lead to unexpected costs if not managed properly.
To reduce data scan costs:
- Use partitioned tables to limit date based queries
- Apply date range controls in Looker Studio
- Avoid querying raw event level data when summaries are sufficient
- Use scheduled queries to pre process data
Efficient data scanning keeps analytics costs predictable while maintaining high performance for reporting.
Designing User Friendly Dashboards
A user-friendly dashboard presents insights clearly and allows viewers to understand key metrics without confusion. Effective dashboards use a clean layout, logical grouping of related metrics, and consistent labeling across visual elements. Avoiding overcrowded charts and focusing on the most important metrics helps users quickly interpret data and make informed decisions without additional explanation.
Managing Data Refresh and Caching
Looker Studio uses data caching to improve dashboard speed and reduce repeated queries on BigQuery. Understanding how caching works allows you to balance data freshness with performance and cost. For most reporting needs, cached data provides sufficient accuracy while improving load times. Managing refresh behavior carefully ensures dashboards remain fast, reliable, and cost efficient without unnecessary data processing.
Common Issues and Troubleshooting
Even with proper setup, users may encounter issues when connecting BigQuery to Looker Studio or when working with dashboards at scale. Most problems are related to permissions, query performance, data consistency, or unexpected costs. Understanding these common challenges makes it easier to identify root causes and apply the right fixes without disrupting reporting workflows.
Permission and Access Errors
Permission related errors are among the most frequent issues when connecting BigQuery to Looker Studio. These usually occur when the Google account used in Looker Studio does not have sufficient access to the BigQuery project, dataset, or tables. Missing roles can prevent queries from running or datasets from appearing during the connection process. Ensuring that the user has read access to the dataset and permission to run queries typically resolves most access related problems.
Query Timeout or Slow Performance
Slow dashboards or query timeouts are often caused by inefficient SQL queries or large data scans. When dashboards query raw or unfiltered data, BigQuery may take longer to process results, leading to delays in Looker Studio. Optimizing queries by limiting fields, applying filters early, and using aggregated or partitioned tables can significantly improve performance. Using views or pre-processed tables also helps ensure dashboards load consistently.
Data Mismatch or Missing Fields
Data mismatches or missing fields can occur when the underlying BigQuery schema changes after a dashboard is created. Renaming fields, changing data types, or removing columns can break existing charts or calculations in Looker Studio. Refreshing the data source schema and validating field definitions usually resolves these issues. Maintaining consistent schemas and versioning changes carefully helps prevent reporting disruptions.
Cost Related Concerns
Unexpected costs can arise when dashboards trigger frequent or expensive queries on large datasets. High query frequency, wide date ranges, and unoptimized tables can increase data processing charges. Monitoring query usage, applying date range controls, and using summary tables help control costs. Reviewing billing reports regularly ensures that dashboard usage remains within budget while maintaining reliable access to insights.
Security and Data Governance Considerations
When using BigQuery with Looker Studio, security and data governance are just as important as performance and usability. Dashboards often contain critical business data, and improper access control can lead to data leaks or misuse. Establishing strong governance practices ensures that data remains secure, accurate, and accessible only to authorized users.
As dashboards are shared across teams and stakeholders, maintaining control over who can view, edit, or distribute data becomes increasingly important. Clear governance policies help standardize how data is accessed and presented, reducing inconsistencies and misinterpretation. By defining ownership, access rules, and data usage guidelines early, organizations can scale their reporting efforts confidently while maintaining security and compliance.
Managing User Access in BigQuery
BigQuery uses role based access control to manage who can view or query data. Assigning the right roles at the project, dataset, or table level helps limit access to only what users need. Granting minimal permissions reduces the risk of accidental data changes or unauthorized exposure. Regularly reviewing access roles ensures that former team members or inactive accounts do not retain unnecessary permissions.
- Apply least privilege access principles
- Assign roles at the dataset or table level when possible
- Review and update access periodically
- Prevent accidental data modification or exposure
Using Authorized Views
Authorized views provide a secure way to expose only specific columns or filtered data to Looker Studio users. Instead of granting direct access to raw tables, views allow you to control exactly what data is visible. This approach is especially useful when dashboards need to share limited insights without revealing full datasets.
- Restrict access to sensitive columns
- Share only required data for reporting
- Maintain consistent metrics across dashboards
- Add an extra layer of security to reporting
Handling Sensitive Data in Dashboards
Dashboards may include sensitive information such as revenue figures, customer identifiers, or internal performance metrics. Protecting this data requires careful handling at both the data and visualization layers. Masking sensitive fields, excluding personally identifiable information, and restricting dashboard sharing permissions help prevent unintended access.
- Avoid exposing personally identifiable information
- Mask or exclude sensitive metrics where needed
- Control dashboard sharing and viewer permissions
- Follow organizational data governance policies
Frequently Asked Questions
Do I need technical skills to connect BigQuery with Looker Studio?
Basic technical knowledge is helpful, but advanced skills are not mandatory. You should understand how BigQuery projects, datasets, and tables are structured. For advanced use cases such as custom SQL queries or performance optimization, basic SQL knowledge can significantly improve dashboard quality and efficiency.
Is Looker Studio free to use with BigQuery?
Yes, Looker Studio is free to use and includes a native BigQuery connector. However, BigQuery itself follows a usage based pricing model, so query execution and data storage may incur costs depending on how much data is processed and how frequently dashboards are refreshed.
How often does Looker Studio refresh data from BigQuery?
Looker Studio uses caching to balance performance and cost. Data is not always refreshed in real time by default. Refresh frequency depends on cache settings, user interactions, and query behavior. For near real time reporting, proper query optimization and controlled refresh strategies are recommended.
Can I combine BigQuery data with other data sources in one dashboard?
Yes, Looker Studio allows you to blend BigQuery data with other sources such as Google Analytics, Google Ads, or spreadsheets. This makes it possible to create unified dashboards, but care should be taken to ensure consistent join keys and data structures to avoid mismatches.
What is the best way to control access to BigQuery dashboards?
The best approach is to manage access at both the BigQuery and Looker Studio levels. Use role based permissions in BigQuery to control who can query data, and restrict dashboard viewing or editing rights in Looker Studio. Using authorized views also helps limit exposure to sensitive data.
Conclusion
Connecting BigQuery with Looker Studio provides a powerful and scalable approach to data analytics and dashboard creation. By combining BigQuery’s ability to process large datasets with Looker Studio’s flexible visualization capabilities, businesses can move from raw data to meaningful insights efficiently and reliably.
A successful integration depends not only on the connection process but also on following best practices around query optimization, cost management, dashboard design, and data governance. Proper planning, secure access control, and thoughtful dashboard structure ensure that reports remain accurate, fast, and easy to use as data volumes grow.
When implemented correctly, BigQuery and Looker Studio together create a reliable analytics foundation that supports data driven decision making across teams. Whether you are building performance dashboards, operational reports, or executive level insights, this combination offers the flexibility and scalability needed for modern data reporting.
As organizations continue to rely more heavily on data for strategic decisions, having a dependable reporting setup becomes essential. BigQuery and Looker Studio enable teams to adapt quickly to changing data needs, integrate new data sources, and scale dashboards without major rework. This flexibility ensures that your analytics infrastructure remains future ready while continuing to deliver consistent and trustworthy insights over time.
January 14, 2026
How to Automate Data Pipelines for Faster and...

January 14, 2026